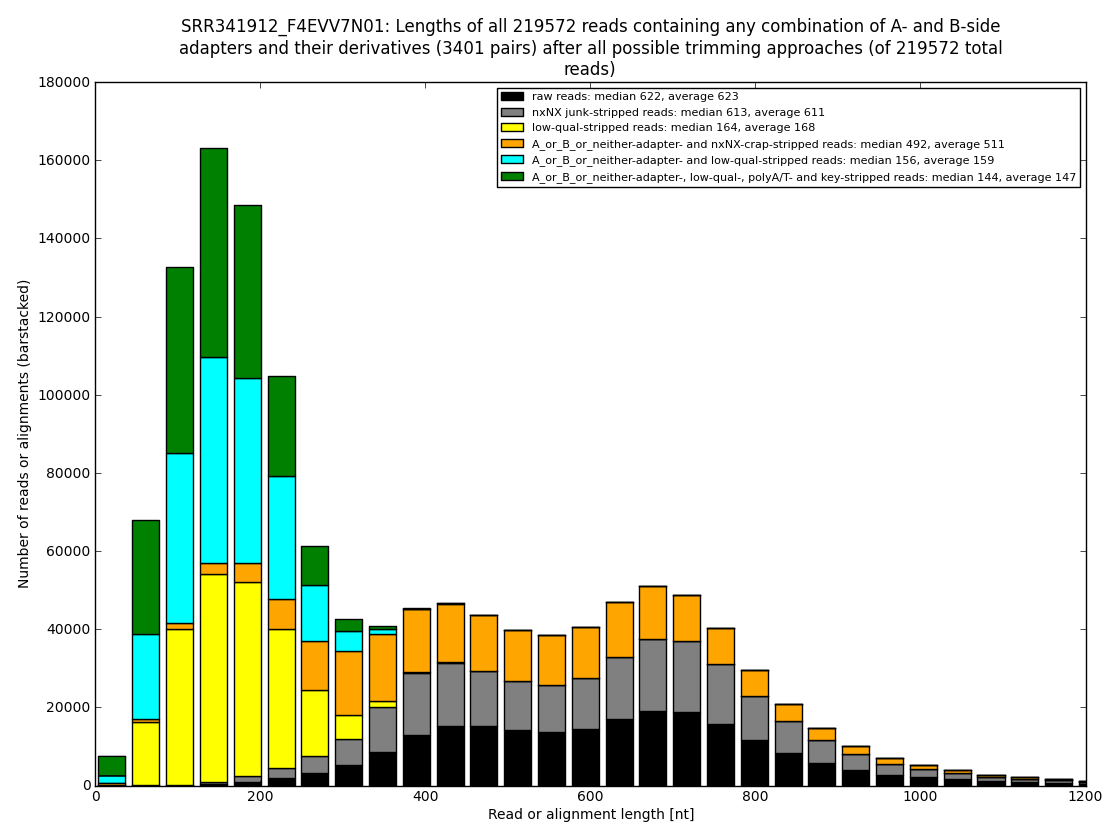
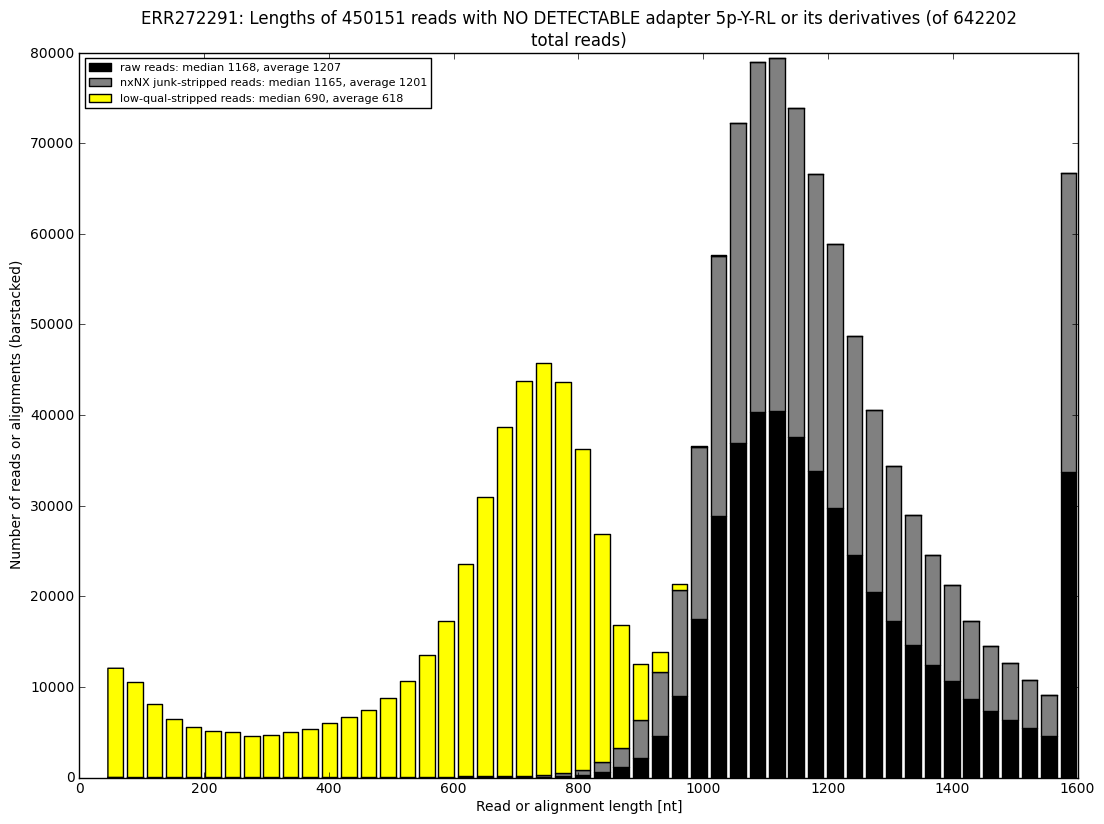
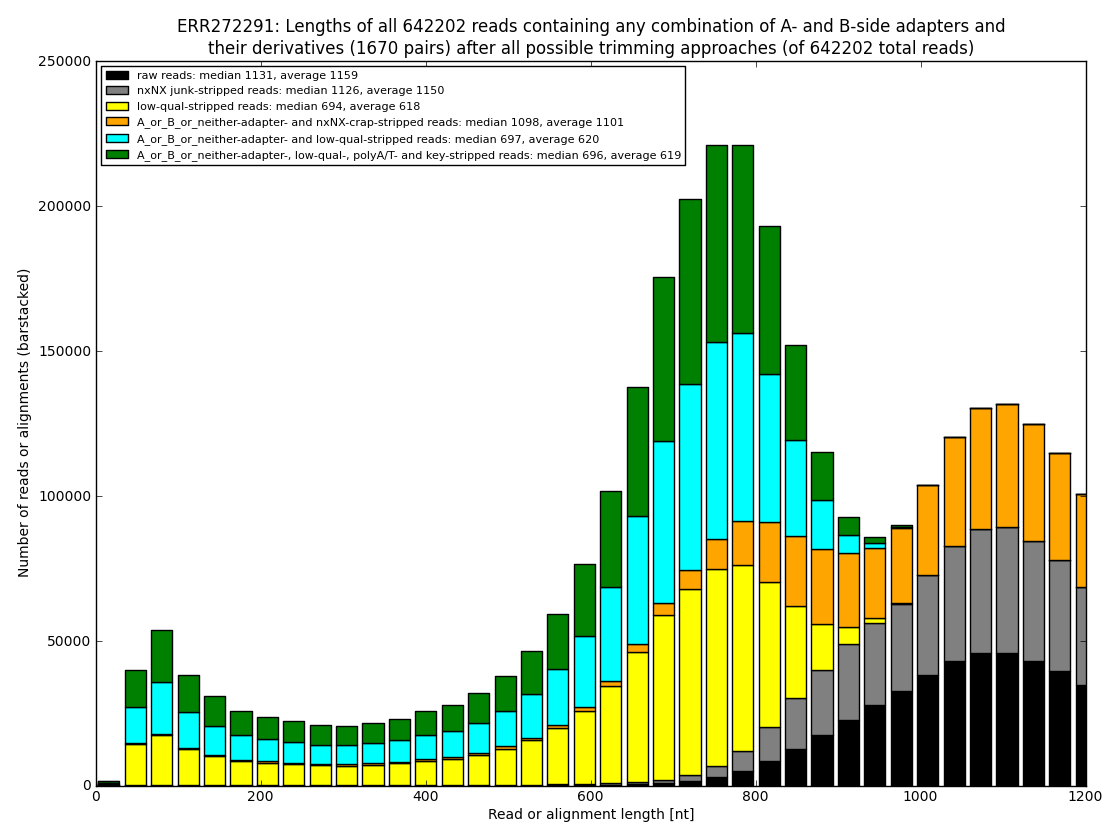
The database of plethora of existing adapters, laboratory protocol artifacts, sequencing artifacts, sequencing errors and the accompanied software developed to uncover them is not available to end users.
However, below is a rough sketch of the analysis flow. The files actually delivered to customers differ by pricing and some are not available until evtl. publication of the approach.
A flow chart of the work is the following
1. read input data (SFF/FASTQ/FASTA)
2. determine sample MID tags
3. determine laboratory protocol used for sample preparation
4. determine laboratory protocol used for sequencing
5. dynamically prepare queries for Smith-Waterman searches using both, NCBI blastn and EMBOSS water
6. search for A-side (left) key, MIDs, artefacts, adapters
7. filter candidate results, tune results, merge closely matched hits
8. search for B-side (right) MIDs, artefacts, adapters
9. filter candidate results, tune results, merge closely matched hits
10. output CSV files with primary results
11. calculate trimming results and write additional CSV files
12. draw charts showing quality of the dataset, incidence of various types of artifacts, errors and adapters, draw the top-most cases into separate figures
13. write corrected output files (SFF/FASTQ/FASTA)
14. write optimized output files (SFF/FASTQ/FASTA with adjusted quality trim points to yield longer usable sequence)
The FASTQ and FASTA/QUAL files have even corrected polyA and polyT sequences which are, for convenience, left in the trimmed sequences in lower-cased letters. Therefore, an assembler may respect the authentic polyA of the transcript while reconstructing the full-length splice variant.


